![AdsKeeper_Logo_Help_Center.svg]](https://help.adskeeper.com/hubfs/AdsKeeper_Logo_Help_Center.svg)
Overview
The Summary Metrics dashboard gives you a quick overview of campaign performance and its overall contribution to your marketing results.
You can review key advertising results, customize the metrics displayed, and compare the selected period with an earlier period to identify performance trends.
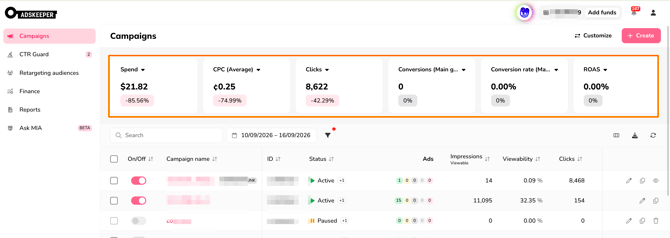
When you open the Campaigns dashboard, six metrics are shown by default:
- Spent: the total amount spent on advertising during the selected period. Use it to assess the effectiveness of your investment.
- CPC (Cost Per Click): the average cost of one click. This metric supports bid management and helps you understand campaign costs.
- Clicks: the total number of clicks received by your ads and the resulting potential for generating revenue.
- Conversions: the number of conversions achieved in line with the campaign’s primary goal.
- Conversion Rate (CR): the percentage of visitors who completed a conversion. It helps evaluate how effectively your ads generate results.
- ROAS (Return on Ad Spend): the relationship between your advertising costs and the revenue generated.
Managing the Metric Blocks
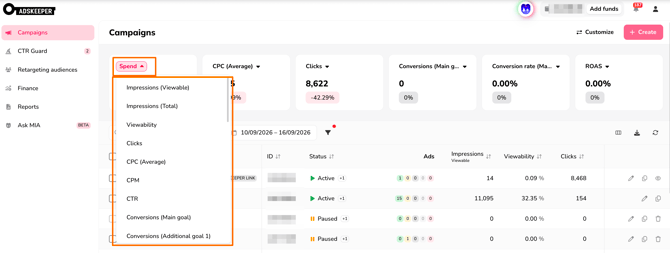
The dashboard always contains six metric blocks. You cannot remove existing blocks or add new ones, but you can replace the metric displayed in each block.
If necessary, you can select the same metric in multiple blocks.
All metrics available in the column picker on the main page can be selected, except:
- Test conversions
- Daily budget
- Overall budget
- Metrics that are not stored or calculated
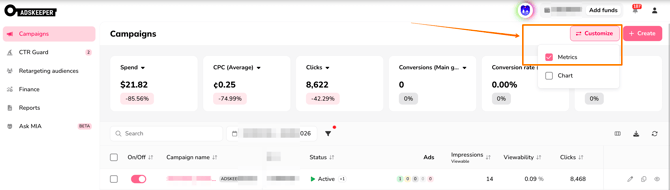
You can hide the Metrics section using the Customize button. Untick the respective box to hide it.
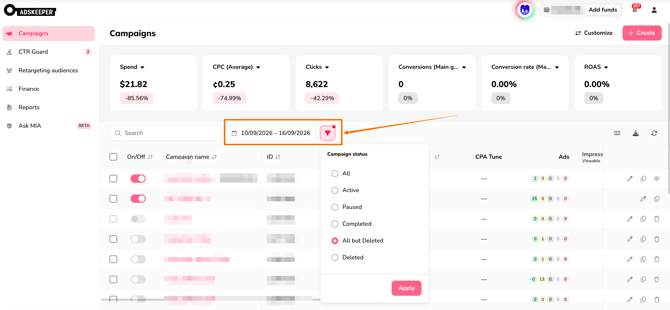
The metrics follow the same filters as the campaign table, including the selected date range, campaign status, and search term.
Comparing Performance Periods
For each metric, the dashboard shows whether the result has increased or decreased compared with the previous period. The difference is displayed as a percentage.
The comparison uses two periods of equal length. For example, if you select 25 days in the calendar, the dashboard compares the results with those from the preceding 25 days.
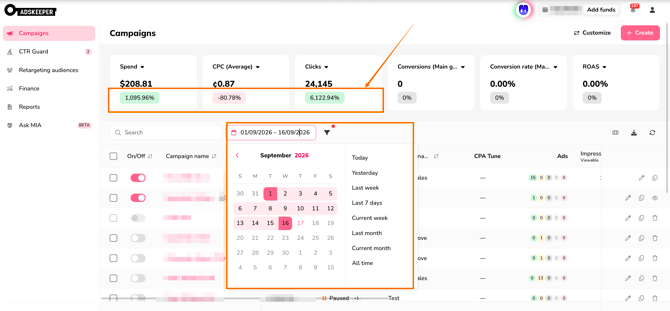
When you select Current month, the system compares the data available for the current month (for example, the first 25 days) with the full number of days in the previous month.
The same logic applies when you select Current week.
If a metric’s value is zero, both the metric and its percentage difference are displayed as zero. This keeps the information consistent and prevents misleading comparisons.
Your metric selections are saved for the client ID. You will not need to configure the dashboard again each time you log in.
The Summary Metrics dashboard is designed to help you monitor campaign results and make more informed optimization decisions.